
|Articles|December 2, 2016
- Pharmaceutical Technology-12-02-2016
- Volume 40
- Issue 12
Building a Better Bio/Pharma Career
Author(s)Rita C. Peters
Survey reveals optimism, discontent, and a desire for better career opportunities.
Advertisement
Bio/pharma executives found themselves under fire in 2016 over allegations of excessive drug price increases, unethical business practices that contribute to the growth of opioid addiction, and executive compensation. While some top-level decision-makers made headlines, the bio/pharma employees who serve as the foundation for the development and manufacture of new therapies were generally optimistic about the employment picture amid negative corporate news, organization restructuring, and shifting priorities.
These employees were slightly more confident in job security in 2016 compared to previous years (Infographic 1) and expressed a continuing interest in career development, challenging work, and fair compensation, as reported in the 2016 Pharmaceutical Technology/Pharmaceutical Technology Europe annual employment survey (1). Overall, the 2016 survey responses were similar to opinions about the employment market as the 2015 survey (2), but respondents also expressed strong desires to seek better pay and career opportunities.
Nearly three-quarters (74.9%) agreed or strongly agreed that their job was secure despite changes at their companies. More than half of the respondents reported an organizational change in their companies; 28.8% via merger or acquisition and 24.7% by downsizing/restructuring. The company changes had a modest effect on respondents; 39.4% reported changes to job responsibilities and less than 5% said they left the company.
Survey respondent profile
More than 440 bio/pharma professionals from around the globe responded to the 2016 Pharmaceutical Technology/Pharmaceutical Technology Europe employment survey, which was fielded in September and October 2016. Respondents were from innovator bio/pharmaceutical companies (25.8%), generic-drug manufacturing companies (23.8%), contract research and manufacturing organizations (17%), consulting firms (8.4%), equipment and raw materials suppliers (7.2%), academic institutions (4.8%), and government/regulatory organizations (2.5%).
The companies that employ the respondents develop or manufacture both small- and large-molecule drugs (35%), small-molecule drugs only (29.5%), or large-molecule drugs only (10.3%); 5.3% are involved in cell therapy or regenerative medicine. The respondents are employed at a mix of privately held companies (53.1%), publicly traded companies (33.1%), and non-profit/academic/government groups (13%).
Respondents reported a range of job responsibilities; quality control/assurance (27.3%), R&D (24.0%), and validation (22.5%) were the top responses. More than one-third (38.2%) work for companies with more than 5000 employees; 37.4% work for companies with fewer than 500 employees.
Geographically, 49.1% of the respondents were from the United States; 26.7% were from Europe, 9.5% from Asia, 5.4% from Central and South America, and 1.6% from the Middle East. Nearly two-thirds of the respondents were over age 40, and 68% were male. Nearly one-quarter held doctorate degrees; 42.5% held Master’s degrees.
The respondents had a range of experience in the bio/pharma industry; 25.8% had fewer than 10 years of experience, 32.2% had 10-20 years, 32.4% had 20-35 years of experience, and 7.6% have worked in the industry for more than 35 years.
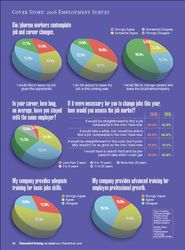
Respondents also reported employment mobility. While three-quarters of the respondents have more than 10 years of experience in bio/pharma, 34.1% stayed with the same employer, on average, for 3 to 5 years; 28.7% stayed for 6 to 10 years; and 34.9% have stayed with the same employer for more than 10 years (Infographic 2).
Workloads continue to rise
While reported workloads remain stable or decreased slightly compared to recent years, most respondents are working more hours than they are contractually obligated. In 2016, 59.4% said their workload increased, down slightly from 60.7% in 2015.
Nearly one-third of the respondents (32.1%) say they worked more hours in 2016 than two years ago, similar to responses in 2015. While more than one-half of the respondents said they were contracted to work approximately 40 hours per week, only 23.7% reported working 40 hours. More than one-third (36.2%) said they were contracted for more than 40 hours per week; however, more than 70% of the respondents said they work 40 or more hours per week.
Only 26% reported that they used their full allotment of vacation, personal, and sick time. A similar percentage (27.5%) said they used less than half of the available time off.
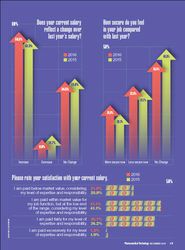
Stable salary dissatisfaction
Satisfaction with salary levels was stable for the past two years after jumping from 2014 and 2013 levels; in 2016, 62% reported dissatisfaction with their compensation. More than 41% of the respondents said they were paid at the low end of the salary range for their job function for their expertise and responsibility; nearly 21% said they were paid below market value, mirroring sentiments from 2015 (Infographic 1).
A slightly higher percentage of respondents reported pay increases; in 2016, 56.5% reported salary increases, up from 53.5% in 2015 (Infographic 1). The rate is still off previous levels of 61.4% in 2014.
Other factors besides compensation lead to employee satisfaction or dissatisfaction. Most respondents said their work is fully valued by their employer (31.6% strongly agreed; 49.7% agreed). More than 80% said they do not experience discrimination in their work, and 86.7% said gender was not a factor in determining or limiting professional advancement at their current company. Female respondents reported slightly higher levels of perceived discrimination than males.
A strong majority (83.9%) felt their skills and training are used to the fullest level; however, the sentiments for career advancement and professional development were less optimistic.
Just more than half of the respondents (56%) said there was opportunity for career advancement in their present position; only 17% agreed strongly that there was potential for advancement at their present company. Two-thirds agreed that there was opportunity for professional development at their present company.
Career development and mobility
While career development is a priority for bio/pharma employees, survey respondents reported mixed feelings about the type of training and opportunities in their present positions. More than 80% agreed or strongly agreed that their company provided adequate training for basic job skills. Nearly 40%, however, felt their companies did not provide advanced training for employee professional growth (Infographic 2). Improving quality and regulatory knowledge, building management skills, and technical training were frequently mentioned areas for training.
In 2016, more than half (54.5%) of the survey respondents agreed somewhat or strongly that they would “like to leave their job, given the opportunity,” down slightly from 55.8% in 2015. Once again in 2016, most respondents (63.6%) plan to stay with their positions next year, compared with 62.4% in 2015 (Infographic 2). Nearly 17% believe they will leave their present position involuntarily in the next year.
The actual frequency of job changes reported was much lower; only 17.2% reported a voluntary job change in the past two years. More than 22% of the respondents, however, agreed or strongly agreed that they would like to change careers and leave the bio/pharma industry (Infographic 2).
Confidence levels of those seeking new positions within the industry were up slightly in 2016 compared to 2015; 20.4% said it would be straightforward to find a comparable new job; 46.9% said it may take a while, but they would be able to find a comparable position. Of the less optimistic responses, 15.8% said it would be straightforward to find a job, but the new job probably would not be as good as the current position; and almost 16.9% anticipated a difficult search and they would have taken the position that was available (Infographic 2).
Professional advancement was a recurring theme for survey respondents and was the most frequently cited factor (38.5%) that respondents “would change jobs for this alone.” Work/life balance (38.3%) and salary (35.1%) were other lead factors for changing jobs.
Salary, intellectual challenge, retirement benefits, and a tolerant workplace were cited as the top factors that were important, but not sufficient on their own to change jobs. Health insurance, commuting time, geographic location, and vacation allotment were the least important factors.
What motivated bio/pharma employees to continue in their job positions in 2016? Challenging projects (38.4%), intellectual stimulation (37.4%), a good work/life balance (34.2%) were the top three reasons respondents gave for going to work. Adequate resources/infrastructure for required tasks (68.4%), adequate time to complete projects (61.3%), and tolerance and opportunity for all employees (59.1%) were identified as important contributors to job satisfaction, but not the sole reason that people go to work.
But not everyone was satisfied. Low pay (cited by 18.3%), discrimination and limited growth opportunities (16.5%), and issues with management (15.15), were reasons respondents said they would “quit their job for this factor alone.”
References
1. 2016 Pharmaceutical Technology/Pharmaceutical Technology Europe Employment Survey.
2. 2015 Pharmaceutical Technology/Pharmaceutical Technology Europe Employment Survey.
Article Details
Pharmaceutical Technology
Vol. 40, No. 12
Pages: 14–17
Citation
When referring to this article, please cite it as R. Peters, “Building a Better Bio/Pharma Career," Pharmaceutical Technology 40 (12) 2016.
Articles in this issue
about 9 years ago
Options in Employee Trainingabout 9 years ago
Biosimilars Supporting Contract Manufacturers’ Growthabout 9 years ago
Airlocks for cGMP Facilitiesabout 9 years ago
Evaluating Mixing in a Single-Use Bioprocessing Systemabout 9 years ago
Shrink Banders for Labeling Applicationsabout 9 years ago
Chromatograph Enables Fast Recovery of Target Compoundsabout 9 years ago
Automated Microscope for Multimodal Imagingabout 9 years ago
From Bitter to Sweet: Developing a User-Friendly Painkillerabout 9 years ago
Nurturing the Relationship Between Industry and Regulatorsabout 9 years ago
Getting involved with pharma standardsNewsletter
Get the essential updates shaping the future of pharma manufacturing and compliance—subscribe today to Pharmaceutical Technology and never miss a breakthrough.
Advertisement
Related Content
Advertisement


Advertisement
Advertisement
Trending on Pharmaceutical Technology
1
FDA Grants Priority Review For Pfizer’s Marstacimab for Hemophilia A or B
2
Drug Digest: Outsourcing Partnerships Fuel Global Biopharma Discovery and Scale-Up
3
PharmTech Weekly Roundup - February 6, 2026
4
Women in STEM: Early Phase Drug Development
5